What is a Numbers Infographic Template
As the world becomes more and more visual, infographics have become an essential tool for communicating complex information in an easy-to-understand way.
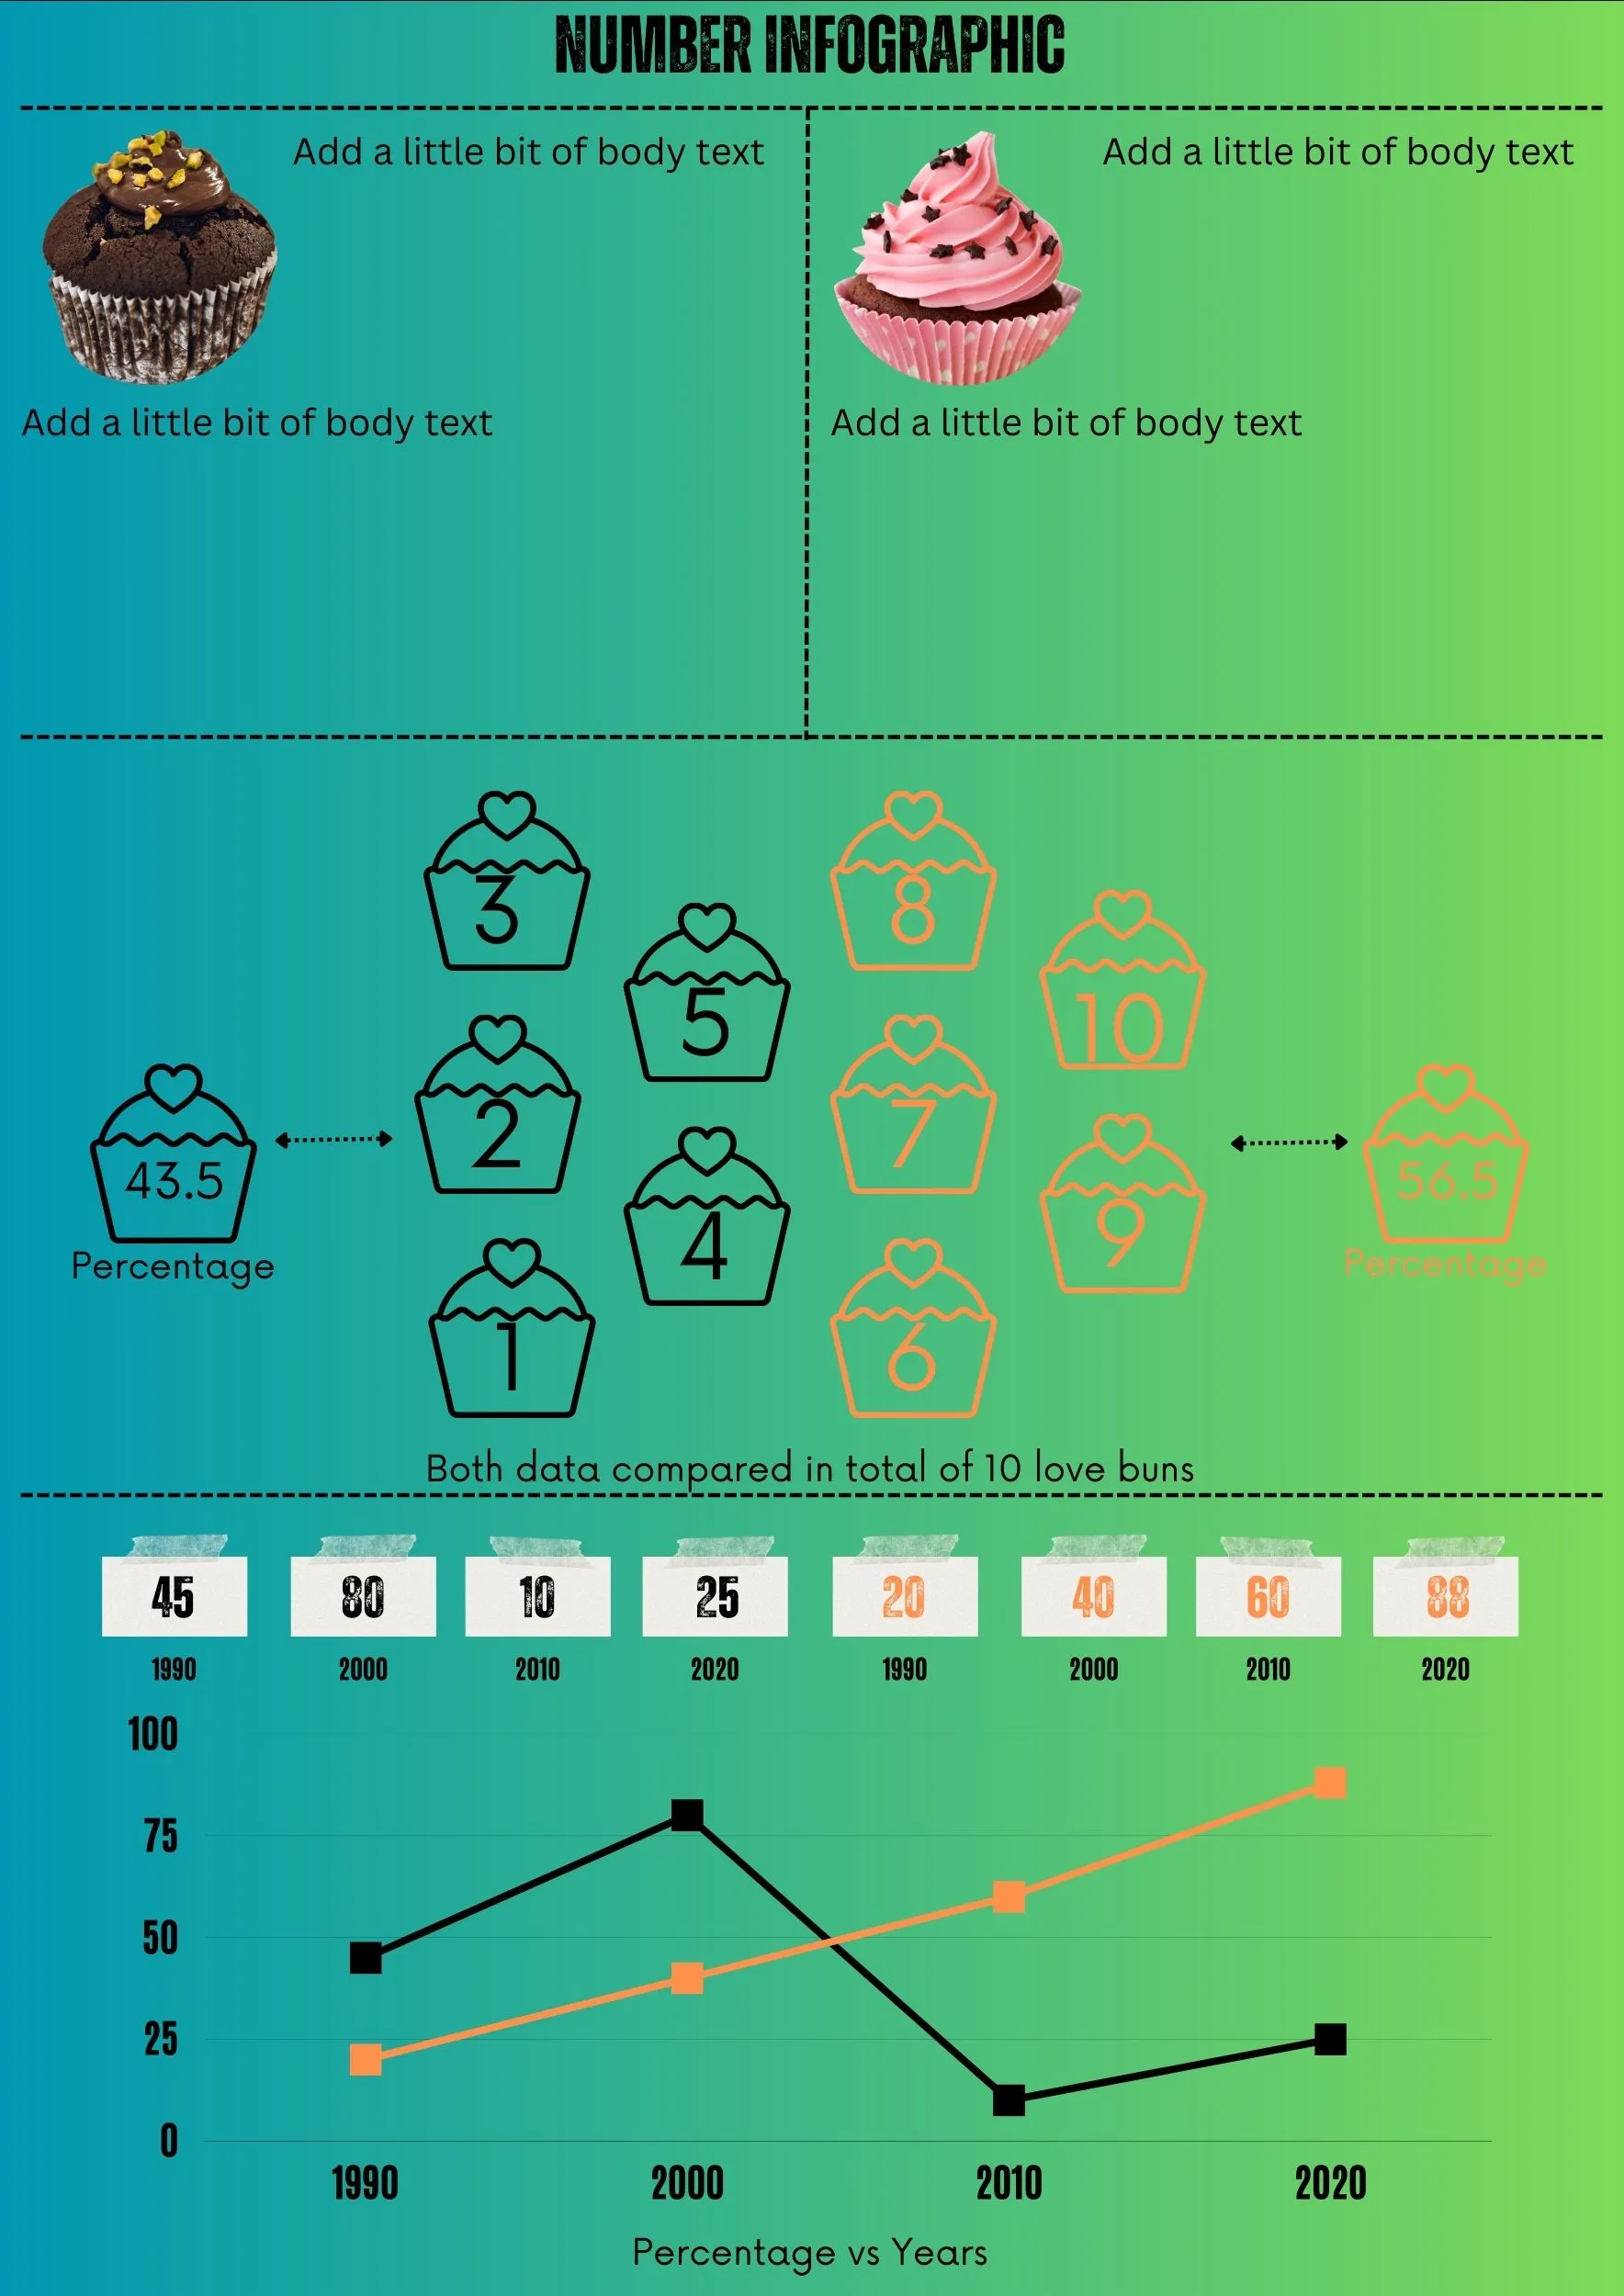
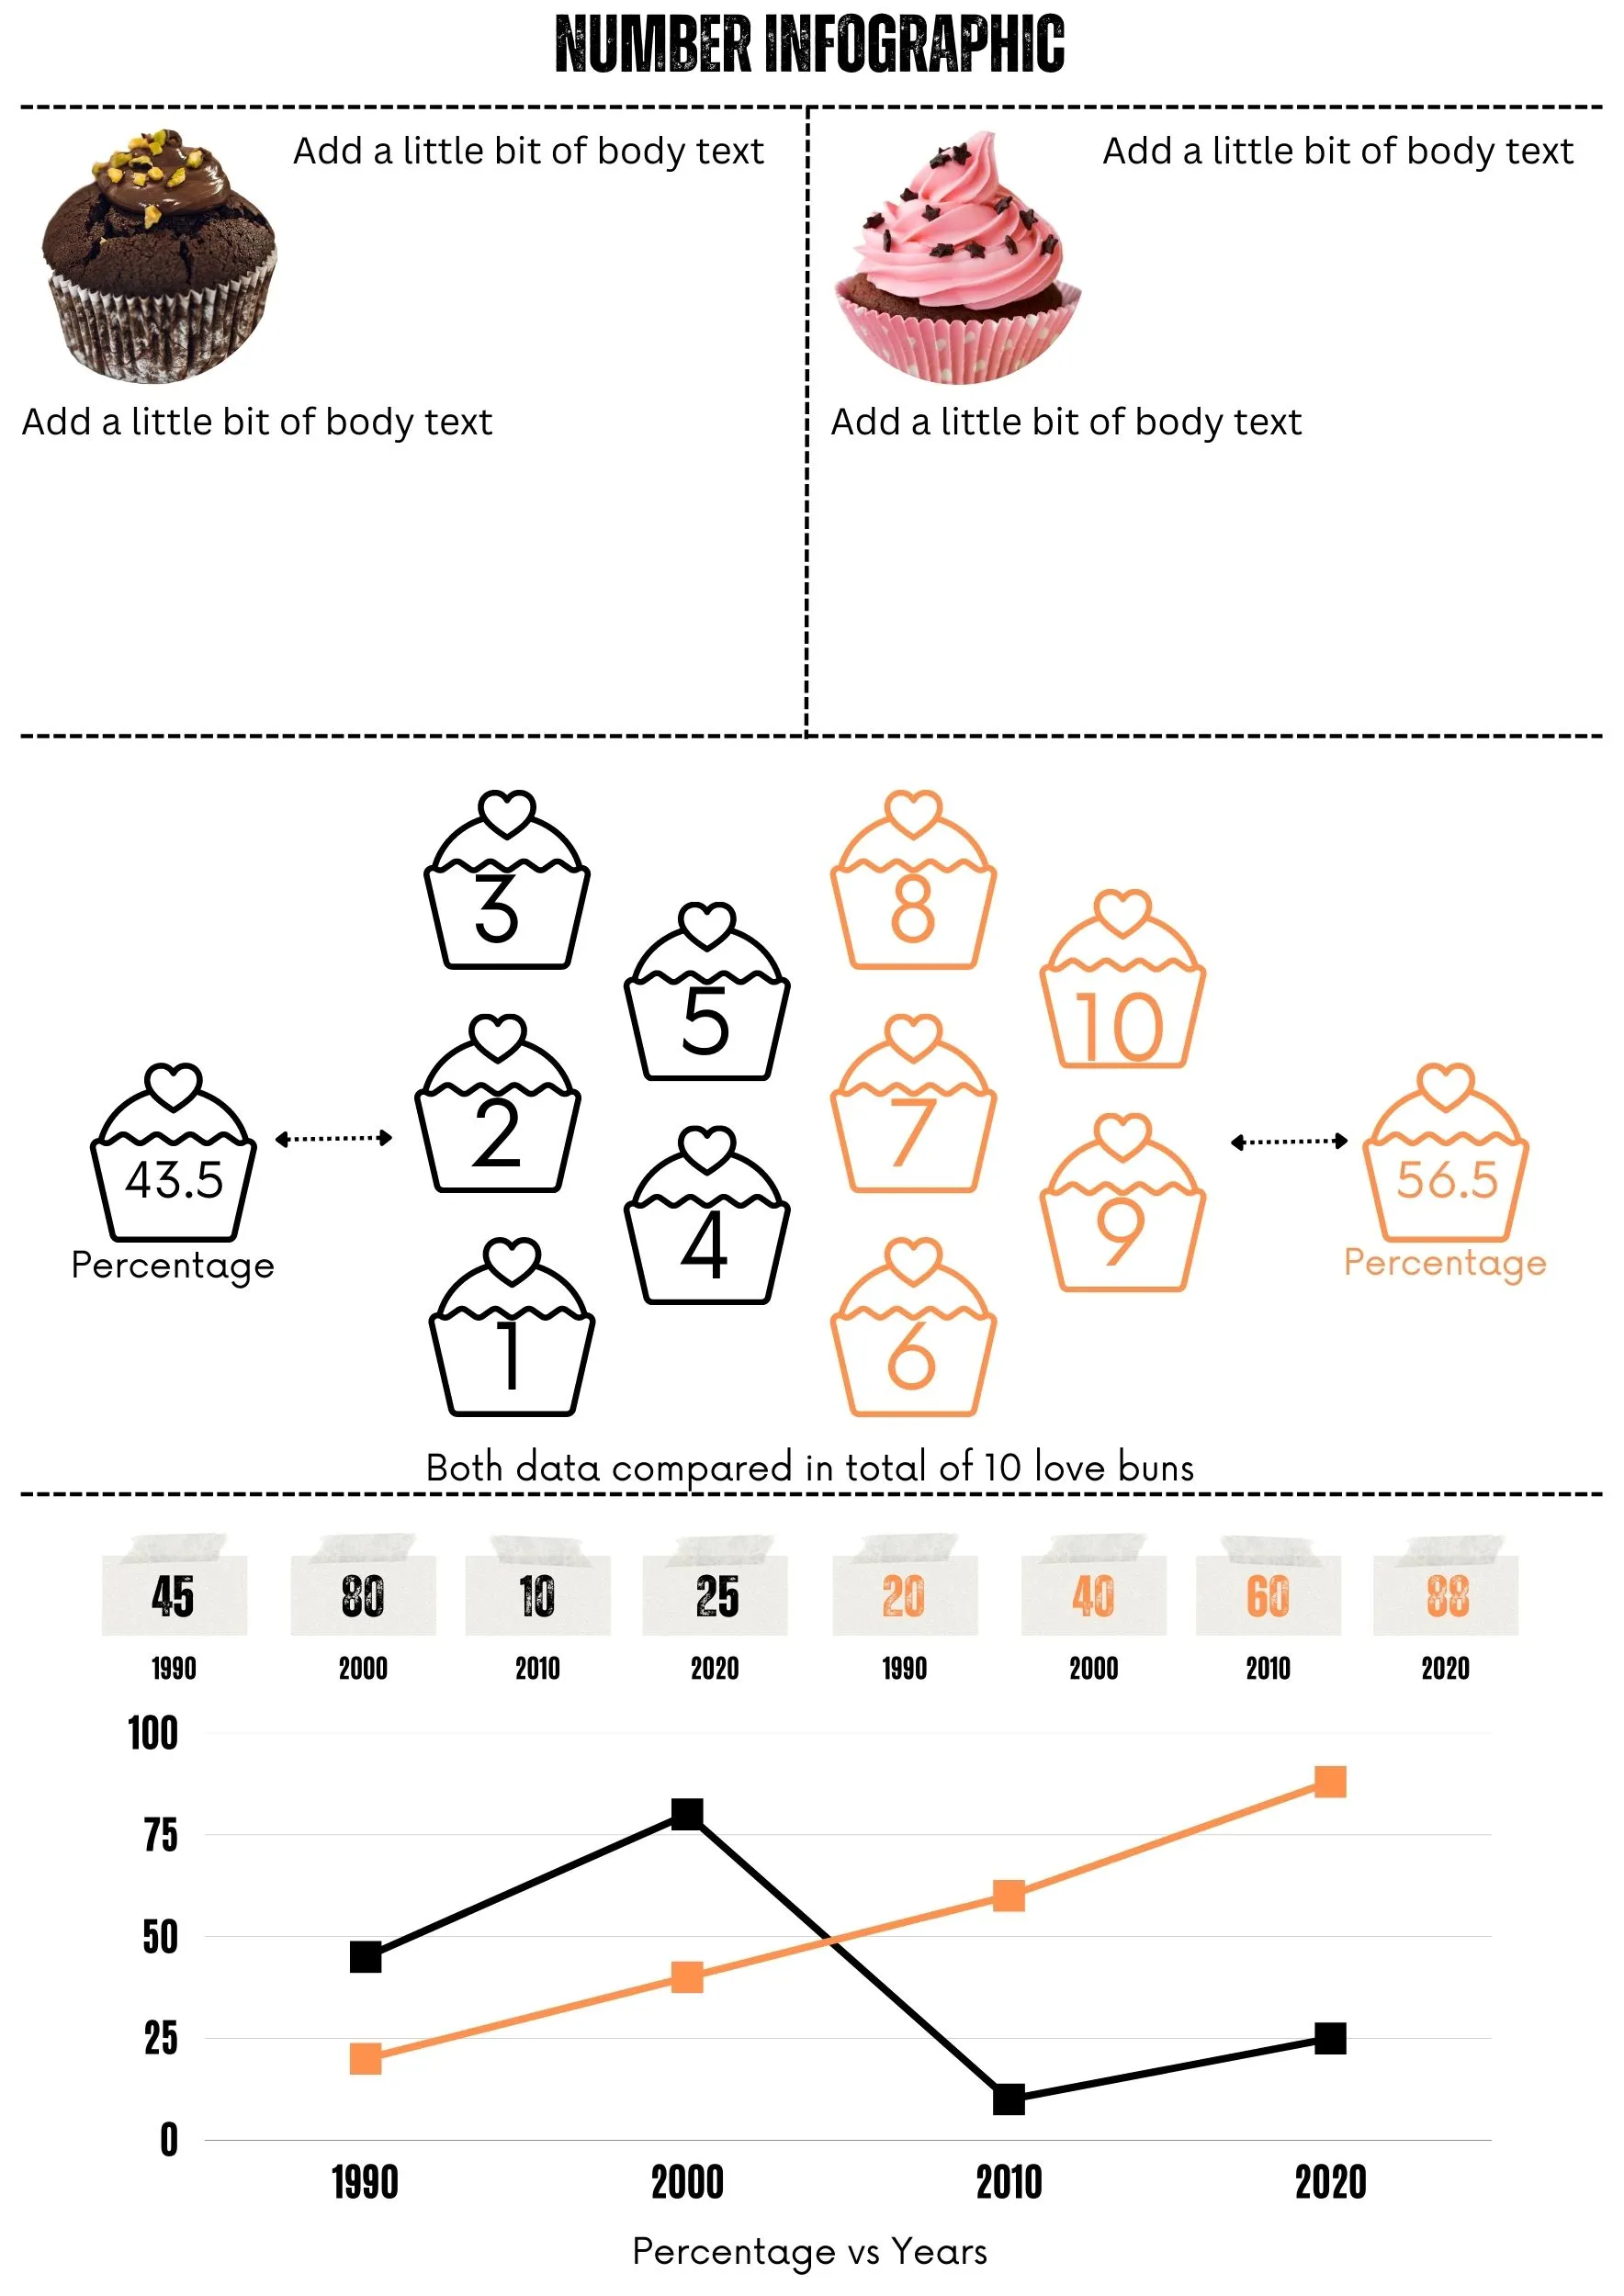
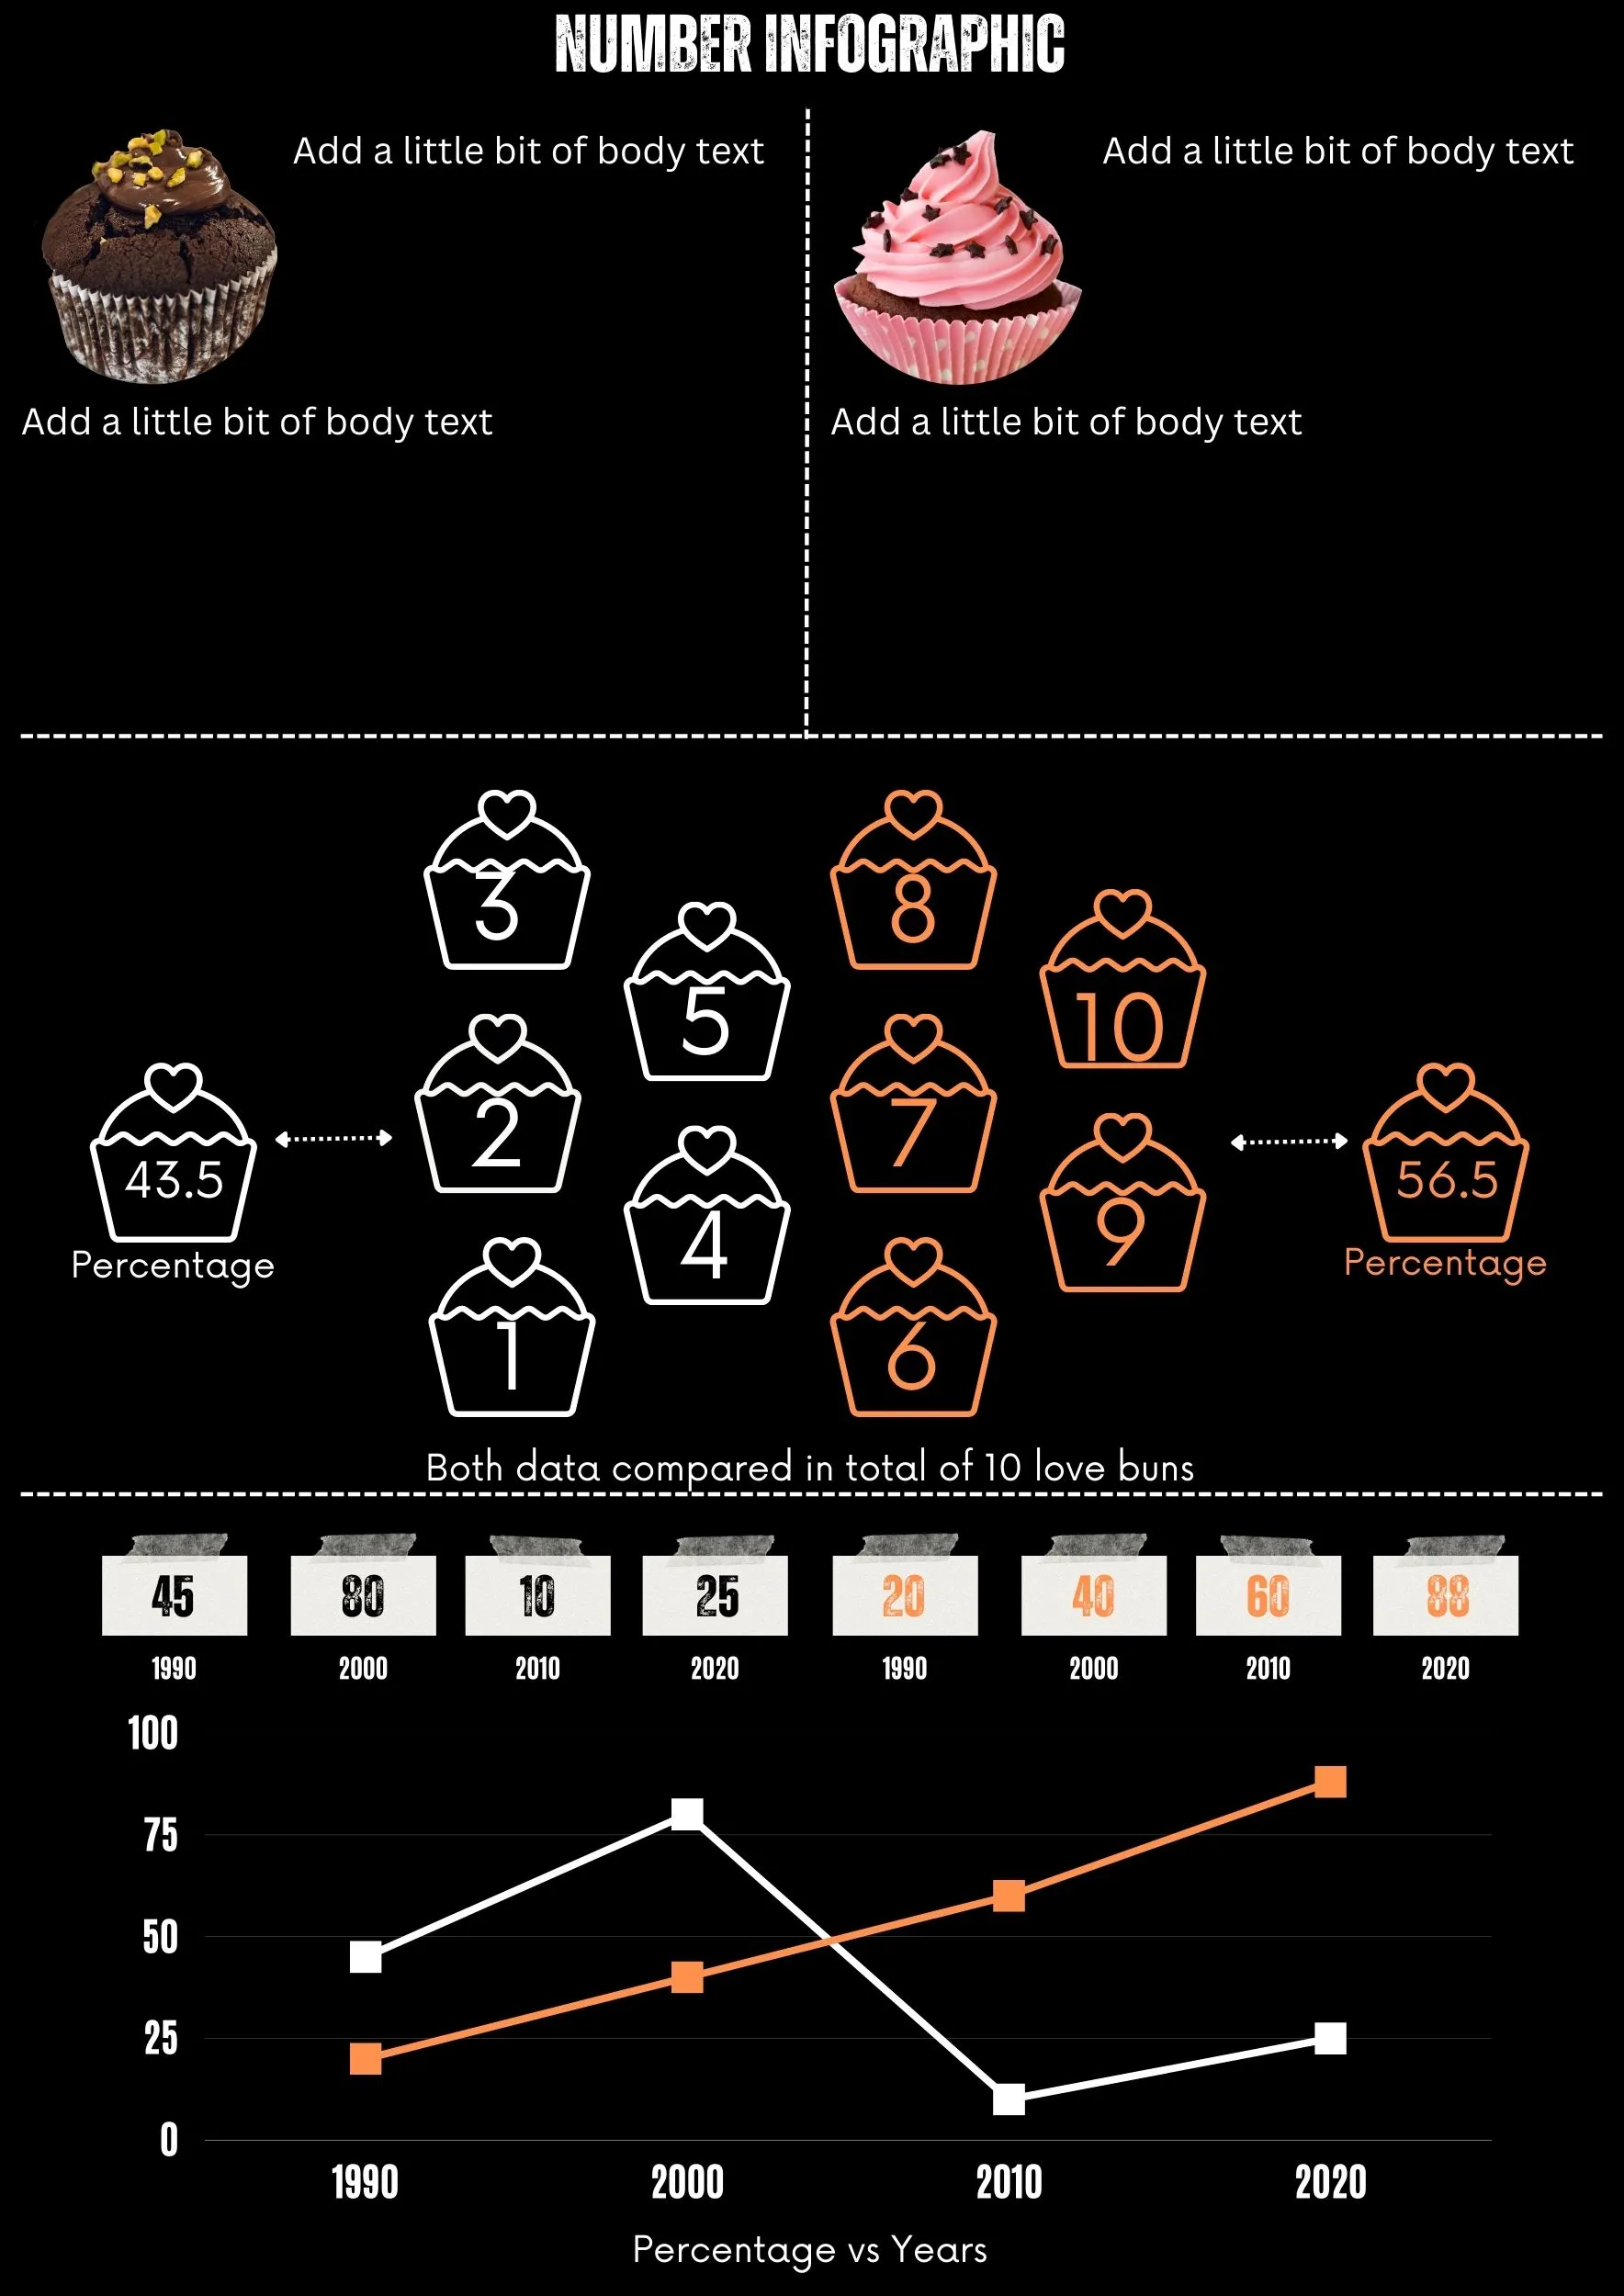
One type of infographic that has become increasingly popular is the visualized numbers infographic template.
A visualized numbers infographic is a type of data visualization that uses images, icons, and other graphical elements to represent numerical data.
It is an effective way to present data in a way that is easily digestible and understandable for readers.
There are many benefits to using these type infographic template.
Firstly, it can help to draw attention to important data points and make them more memorable.
By presenting data in a visually appealing way, readers are more likely to engage with the content and remember key statistics.
Secondly, a visualized infographic can help to simplify complex data. By using images and icons to represent numerical data, it can make it easier for readers to understand the data and see patterns or trends.
Thirdly, visualized numbers infographics can be customized to fit any topic or subject matter.
They can be used to present data on a wide range of topics, from business metrics and financial data to social media statistics and demographic information.
Finally, these infographics are a great way to make data more shareable.
By creating an infographic that is visually appealing and easy to understand, it is more likely to be shared on social media and other platforms, increasing its reach and impact.
In conclusion, a infographic template is an essential tool for anyone looking to present data in a way that is engaging, memorable, and easily understood.
By using images and icons to represent numerical data, it can help to simplify complex information and make it more accessible to readers.
Whether you are presenting data in a business context or for personal use, a infographic can be an effective way to communicate your message.
More Related Topics:
Sign up to get free tips and templates.